High-power electronics and RF applications rely heavily on ceramic substrates for essential thermal management. Standard materials like Al2O3, AlN, and Si3N4 form the foundation of these high-performance systems. A single undetected defect within these substrates can easily lead to catastrophic field failures. As miniaturization and power densities scale rapidly, quality control teams face a critical decision in non-destructive testing (NDT). Manufacturers must guarantee reliable operation under extreme thermal cycling and intense mechanical stress. Evaluating Automated Optical Inspection against acoustic methodologies requires a clear understanding of an operational divide. You must weigh surface-level throughput capabilities against the absolute necessity of internal structural verification. This comprehensive guide breaks down the core differences between optical and acoustic inspection methods. You will learn how to identify distinct defect pathologies across different ceramic materials. By mapping out specific equipment limitations, you can build a highly optimized, hybrid testing funnel tailored directly to your production line.
Key Takeaways
AOI (Automated Optical Inspection) is highly scalable and strictly limited to surface-level anomalies, offering high-speed inline integration.
Scanning Acoustic Tomography (SAT) is the definitive non-destructive method for detecting ceramic substrate internal defects, though it operates at a lower throughput due to physical scanning constraints.
Strategic Deployment: High-reliability production (aerospace, automotive) rarely relies on just one; optimizing the testing funnel involves using AOI for 100% surface screening and SAT for targeted batch or critical-component inspection.
Decision Driver: The choice depends heavily on material type (DBC/AMB), compliance requirements, and acceptable false-negative thresholds.
The Business Problem: Defect Pathology in Ceramic Substrates
Manufacturers use ceramic substrates primarily for their exceptional thermal conductivity and electrical insulation. High-power devices generate immense heat during operation. When substrates contain structural anomalies, they lose their ability to dissipate this heat efficiently. Undetected defects compromise thermal resistance directly. This disruption creates localized hot spots within the module. Localized heating inevitably leads to premature device failure. IGBT modules and power inverters are especially vulnerable to these thermal bottlenecks.
Surface VS. Volumetric Defects
Quality control teams must distinguish between surface-level blemishes and volumetric flaws. Each category requires a fundamentally different inspection approach.
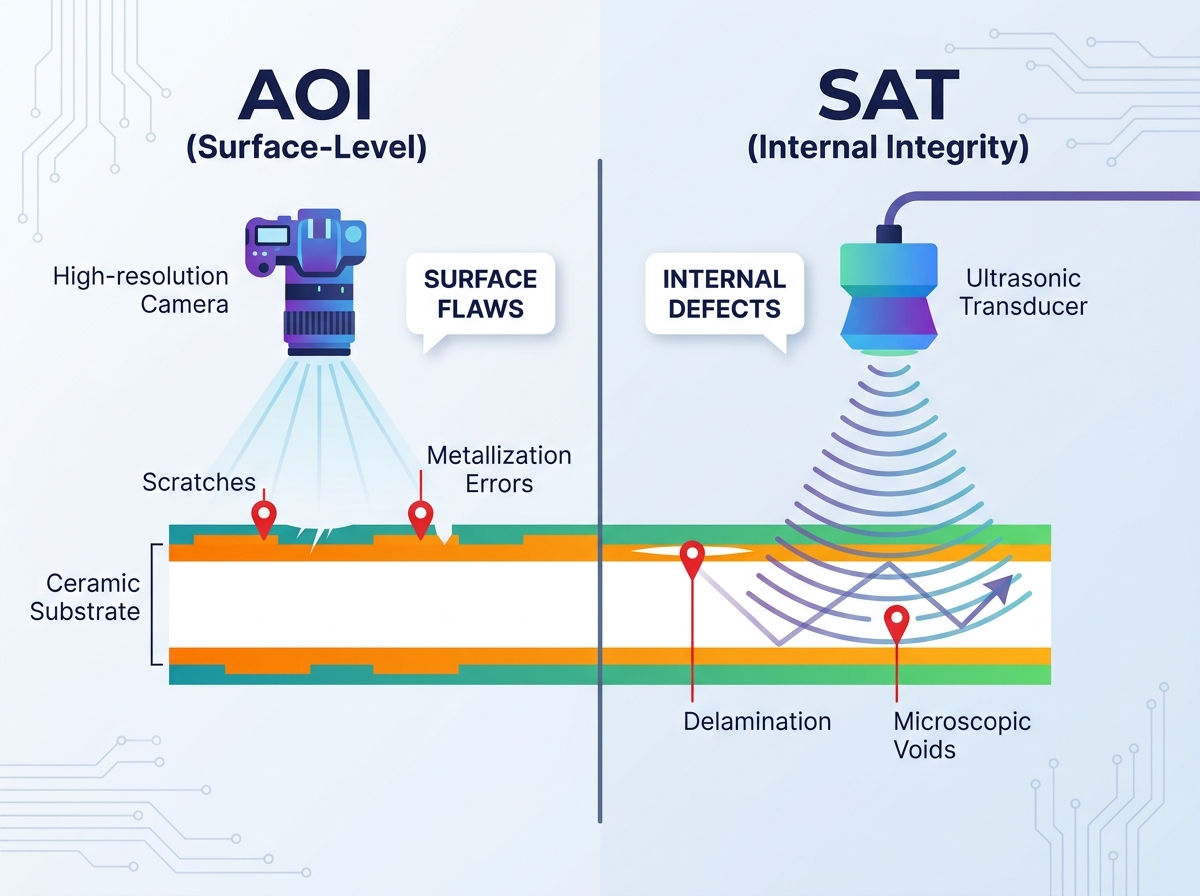
Surface issues: These include handling scratches, metallization errors, etching faults, and surface micro-cracks. They occur on the exterior layers and often affect soldering or wire bonding processes.
Volumetric issues: These represent hidden dangers deep within the material stack. Common ceramic substrate internal defects include delamination at the copper-ceramic interface. You will also find microscopic voids in the brazing layer and internal bulk cracking.
Success Criteria for QC
Modern quality control operations face a constant tug-of-war. You must balance high throughput, measured in Units Per Hour (UPH), against uncompromised detection accuracy. Missing a critical defect is not an option. Production lines must align their testing protocols with rigorous reliability standards. Frameworks like AEC-Q101 for automotive discrete semiconductors or MIL-STD for aerospace components dictate stringent acceptable quality limits. Meeting these standards requires deploying the right inspection technology at the correct stage of assembly.
AOI (Automated Optical Inspection): Strengths and Blind Spots
Automated Optical Inspection serves as the frontline defense in semiconductor manufacturing. It provides rapid visual verification of surface conditions before components move down the line.
How It Functions
AOI systems utilize high-resolution cameras paired with multi-angle lighting arrays. These systems capture detailed images of the passing substrates. Machine vision algorithms analyze the captured visual data. The software scans for visual deviations by comparing the live images against a pre-programmed "golden board" or exact CAD data. Advanced setups incorporate artificial intelligence to reduce false-call rates on complex circuit patterns.
Primary Applications
Production facilities rely on AOI for several vital checks. Teams use these machines for verifying pad dimensions and alignments. The optical sensors excel at detecting surface contamination like residue, or oxidation. AOI is uniquely suited for identifying bridging faults or missing metallization on the substrate surface. It ensures the external geometry precisely matches the intended design.
Operational Advantages
Optical inspection brings tremendous speed to the manufacturing floor. The technology offers high-speed, frictionless integration directly into the continuous production line. Boards pass through the machine via conveyors without stopping for long periods. This continuous flow enables highly scalable data capture. Engineers can use this real-time data for immediate upstream process correction.
Critical Limitations
Despite its speed, AOI suffers from fundamental physical boundaries. The system possesses a strict inability to penetrate opaque materials. Cameras cannot see through copper layers or dense ceramic matrices. AOI provides absolutely zero visibility into the structural integrity beneath the surface metallization. If a massive void exists in the die-attach layer below a perfectly placed chip, the AOI will pass the unit as flawless.
When external visuals are insufficient, engineers turn to sound. Scanning Acoustic Tomography maps the internal terrain of solid components, revealing hidden structural failures.
How It Functions
SAT equipment emits high-frequency ultrasonic pulses directly into the substrate. As these sound waves travel through the material, they encounter different boundaries. Changes in acoustic impedance reflect sound waves back to the transducer. An air gap, such as a void or delamination, presents a massive impedance mismatch. This mismatch reflects nearly 100% of the acoustic energy. The system records these echoes, creating a depth-specific tomographic image known as a C-Scan.
Primary Applications
Acoustic imaging targets volumetric integrity. Engineers deploy it primarily for detecting voiding in critical solder joints. It is the industry standard for finding delamination in Direct Bonded Copper (DBC) or Active Metal Brazed (AMB) substrates. SAT uncovers internal material flaws that would otherwise remain invisible until field failure. It guarantees the thermal pathway from the semiconductor die through the substrate remains entirely unobstructed.
Operational Realities & Risks
Acoustic inspection introduces distinct manufacturing challenges. The technology requires a liquid coupling medium, usually deionized water, to transmit sound waves effectively. Submerging or spraying parts introduces necessary drying and handling steps. These steps complicate automated workflows. SAT inherently produces slower cycle times compared to optical methods. Scanning time correlates directly with your required depth resolution and the physical component size. Furthermore, running these machines requires higher operator expertise. Technicians must understand how to interpret acoustic phase inversions and complex waveform data accurately.
Choosing between visual and acoustic inspection is rarely a binary decision. Quality managers must evaluate how each technology addresses specific production variables.
Detection Capabilities Summary
Feature/ Defect Type
Automated Optical Inspection (AOI)
Scanning Acoustic Tomography (SAT)
Surface Cracks & Scratches
Excellent Detection
Poor / Not Applicable
Dimensional Accuracy
High Precision
Low Precision
Surface Oxidation & Contamination
Excellent Detection
Cannot Detect
Internal Delamination
Zero Visibility
Excellent Detection
Subsurface Voids
Zero Visibility
Excellent Detection
Die-Attach Integrity
Zero Visibility
Industry Standard
Throughput VS. Depth Resolution
The primary trade-off revolves around speed VS analytical depth. AOI provides fast-cycle visual processing. It can scan an entire tray of substrates in seconds. However, it trades volumetric awareness for this speed. SAT offers time-intensive, micrometer-level internal mapping. Gathering detailed acoustic data takes minutes per tray. High-resolution acoustic scans require the transducer to physically raster over the entire component area. You trade production velocity for absolute structural certainty.
Implementation Architecture: Do You Need Both?
Modern manufacturing realities dictate a comprehensive approach. Relying on a single inspection modality leaves unacceptable blind spots in your quality assurance program.
The Hybrid Inspection Funnel
Modern semiconductor and power module lines often layer these technologies. They rarely choose between them. A hybrid inspection funnel maximizes throughput while safeguarding reliability. You capture the easy, surface-level defects quickly. You reserve the slower, more intense inspections for complex internal verifications.
Workflow Integration
Building an effective inspection workflow requires strategic sequencing.
Step 1: 100% Inline AOI. Deploy optical inspection immediately after printing or mounting stages. This instantly rejects units with macroscopic surface flaws. You catch errors before they accrue further manufacturing costs in downstream ovens or wire bonders.
Step 2: Strategic SAT Deployment. Position acoustic testing after curing or reflow stages where internal voids typically form. Use statistical sampling (e.g., 5% of the batch) for standard consumer electronics. Enforce 100% acoustic screening for mission-critical automotive or aerospace batches to guarantee absolute compliance.
Managing the SAT Bottleneck
Because acoustic scanning is inherently slower, it can bottleneck high-volume lines. Manufacturers employ specific techniques to optimize throughput. Multi-transducer scanning systems allow simultaneous inspection of several components. Tray-level batch processing minimizes loading and unloading delays. Implementing automated defect recognition (ADR) software is crucial. ADR algorithms automatically calculate void percentages. They eliminate the need for manual operator interpretation and drastically speed up the pass/fail decision process.
Shortlisting Logic and Next Steps
Transitioning from theory to equipment procurement requires targeted internal audits. You must align your capital investment with your actual defect pathology.
Assessment Checklist
Before contacting equipment vendors, evaluate your production reality.
Are your current field failures driven by surface contamination and poor wire bonding?
Are failures caused by thermal degradation stemming from internal voids?
Does your end-user compliance mandate proof of internal structural integrity?
Can your current cycle times absorb offline acoustic scanning?
Vendor Evaluation Criteria
When speaking to equipment manufacturers, always demand a proof of concept (PoC). Spec sheets rarely tell the whole story. Send sample substrates with known, characterized defects to multiple vendors. Evaluate their equipment based on false-call rates and actual detection thresholds. Pay close attention to how easily their software integrates into your existing Manufacturing Execution System (MES). Require them to demonstrate how their machines handle the specific ceramic materials your facility uses.
Next Action
Your immediate next step requires data gathering. Audit your current failure analysis reports. Categorize the root causes of all recent field returns and end-of-line yield drops. Separate them strictly into surface anomalies VS volumetric failures. Only after mapping your specific failure modes should you begin writing an equipment specification document.
Conclusion
In the debate over surface VS internal inspection, the technologies prove complementary rather than competitive. Automated Optical Inspection protects your production speed. It maintains strict surface quality and catches process drift in real-time. Scanning Acoustic Tomography acts as the definitive firewall. It guards against hidden, catastrophic volumetric failures that visual systems simply cannot see. Integrating both ensures comprehensive quality assurance.
Investing in the right inspection capability requires moving beyond basic spec sheets. You must test your actual ceramic substrates against both optical and acoustic methodologies. By analyzing empirical test data, you can determine the true return on investment for your specific yield challenges. Build a hybrid inspection funnel, optimize your cycle times, and secure the thermal reliability of your highest-power modules.
FAQ
Q: Can AOI detect any internal defects if the ceramic is semi-transparent?
A: Even with slight translucency in materials like thin Alumina, AOI cannot reliably measure or locate volumetric defects. It relies on surface reflection and visual contrast. Subsurface shadows might appear, but optical systems cannot quantify depth, size, or interface separation. It strictly remains a surface-level tool.
Q: Does the water used in Scanning Acoustic Tomography damage ceramic substrates?
A: No. SAT systems utilize highly purified, deionized water as a coupling medium. Manufacturers pair these systems with rapid drying modules or vacuum ovens. Because bare ceramics and metals are non-porous and chemically stable in deionized water, the process is perfectly safe prior to sensitive final packaging steps.
Q: What is the minimum void size SAT can detect in a DBC substrate?
A: Resolution depends entirely on the transducer frequency. Frequencies typically range from 15 MHz to 230 MHz. Higher frequencies detect smaller defects but penetrate less deeply. For standard DBC substrates, high-frequency transducers can reliably detect internal voids and delaminations as small as 50 micrometers.
Q: Is SAT the same as SAM (Scanning Acoustic Microscopy)?
A: SAM represents the broader category of acoustic microscopy technology. SAT specifically refers to utilizing that acoustic data to create distinct depth slices or tomographic images. They are often used interchangeably in the manufacturing industry.
 English
 العربية
 Français
 Русский
 Español
 Português
 Deutsch
 italiano
 日本語
 한국어
 Nederlands
 Tiếng Việt
 ไทย
 Polski
 Türkçe
 Bahasa Melayu
 தமிழ்
 Filipino
 Bahasa Indonesia
 magyar
 Română
 Čeština
 Српски
 हिन्दी
 فارسی
 Slovenčina
 Slovenščina
 українська
 Suomi
 Հայերեն
 עברית
 Latine
 Shqip
 বাংলা
 Eesti keel
 Oʻzbekcha
 latviešu
 Беларуская мова
 Esperanto